이 포스팅은 시각화 정리 시리즈
16 편 중 1 번째 글 입니다.
-
Part 1 - This Post
-
Part 2 - 02: matplotlib 알아보기
-
Part 3 - 03: 산점도
-
Part 4 - 04: Circling을 통한 버블 플롯
-
Part 5 - 05: 선형 회귀 선을 포함한 산점도
-
Part 6 - 06: Strip plot
-
Part 7 - 07: Counts plot
-
Part 8 - 08: Marginal Histogram
-
Part 9 - 09: Correlation plot
-
Part 10 - 09: Marginal Boxplot
-
Part 11 - 10: Pair plot
-
Part 12 - 11: Diverging Bars
-
Part 13 - 12: Diverging lines with text
-
Part 14 - 13: Diverging Lollipop Chart with Markers
-
Part 15 - 14: Area chart
-
Part 16 - 15: Ordered Bar Chart
시각화를 하는데 필요한 다양한 라이브러리에 대해서 알아본다.
joypy
feature에 대한 특징을 밀도 기반으로 깔끔하게 볼 수 있다.

Documentation
pywaffle
분포에 대한 것을 네모 박스로 처리하여 깔끔하게 볼 수 있다.

calmap
히트맵으로 표현해 준다.
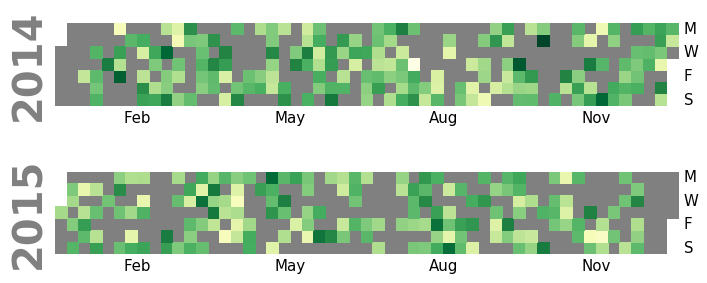
Documentation
pandas
데이터 조작 및 분석을 위해 Python 프로그래밍 언어로 작성된 소프트웨어 라이브러리
Documentation
matplotlib
파이썬에서 매트랩과 유사한 그래프를 그릴 수 있게 도와주는 라이브러리
Documentation
import joypy
from pywaffle import Waffle
import calmap
import pandas as pd
import matplotlib.pyplot as plt

import os
import numpy as np

from scipy.spatial import ConvexHull # 볼록 다각형을 시각화해야할 때가 있다.